Arkansas Creek Monitor — Changelog
Version 2026.7.17.1 — July 17, 2026
The Buffalo wave tracker learned from its first real test — and now grades itself.
- On July 15 an isolated thunderstorm hit Richland Creek and the wave tracker predicted a much bigger rise at St. Joe than actually arrived (the water did come — about 30 minutes after the tracker gave up watching for it). We rebuilt the model behind those predictions: it now looks at where the rain actually fell and how much water the creek pulse is really carrying, so a lone storm cell on one tributary no longer reads like a basin-wide event. Experimental, as always.
- Wave "inbound" cards now stay up longer when the river is low — slow summer water genuinely takes longer to travel, and the tracker's patience now matches that.
- The Prediction Scorecard has a new Routed Waves section: every tracked wave is now graded after the fact — did a real rise arrive, was it inside the predicted range, and did it show up inside the predicted window. Waves are rare, so this table fills in storm by storm.
Not user-facing, recorded for completeness: trib reach models refit on real zone QPE with a 48h outcome window (richland_to_st_joe adds a volume/spikiness feature, both trib reaches add a rain-distribution ratio); wave_router gains volume tracking, a QPE-outage ratio guard, and low-base-flow expiry margins; new prediction_eval/wave_eval.py closes the wave record→settle→score loop; simulator engine/bundle rebuilt and golden-gated (1800/0).
Version 2026.7.14.1 — July 14, 2026
The Cossatot gets its own Neural Net Predictions page.
- New page: Neural Net Predictions for the Cossatot, linked from a violet card on the Cossatot dashboard. Every hour, a neural network trained on 12 years of storms looks at the last 48 hours of 1 km radar rainfall over the watershed — plus the river's own recent behavior and two neighboring gauges — and projects the Vandervoort gauge hour by hour for the next 6 hours, in feet and cfs, with a likely range around each number. Experimental.
- The page also shows the chance the river rises past floatable (3.4 ft) or past high water (5.5 ft) within the next 6 hours. In 12 years of replayed history, the floatable-rise alert caught about 9 in 10 rises with about 9 in 10 of its alerts being real — the strongest numbers of any predictor on the site so far.
- Like everything here, it uses only rain that has already fallen — if more rain comes, the numbers go up, not down. It re-issues every hour as new radar arrives.
- The Prediction Scorecard now grades this predictor too, hour by hour, the same way it grades the Buffalo neural net.
Not user-facing, recorded for completeness: the model is a port of the Buffalo pixel-net architecture (CNN + GRU over a 48×96 1-km window, three gauges multi-task); crossing probabilities come from a companion gradient-boosted ensemble validated at 90.7% recall / 88.0% precision (floatable tier, bootstrap-confirmed) — the full experiment log lives in the operator harness (COSSATOT_NEURAL_PLAN.md).
Version 2026.7.13.3 — July 13, 2026
Easier-to-read text on the Buffalo, Mulberry, and Big Piney cards.
- Fixed hard-to-read text on the Buffalo page's gauge cards — most visibly the green "Falling — typically settles near…" note, which was nearly invisible on a yellow "Low but Floatable" card. Status notes are now white, and colored details (countdowns, alerts, badges) automatically switch to white whenever they'd blend into the card's own color — for example, a red "Time to Too Low" countdown no longer disappears on a green Optimal card.
- The same fix applies to the recession countdowns on the Mulberry and Big Piney section cards.
- The shaded info boxes on yellow cards are slightly darker now, so all their text stands out better.
Version 2026.7.13.1 — July 13, 2026
Tune-up after the radar feature's first storm.
- Reviewed every AI analysis the Ponca card issued through the weekend rain. The radar held up well — its "rain estimates for the next two hours" were essentially unbiased, and its "this rain is about done" calls verified 93% of the time, usually well ahead of the hourly rain totals.
- Fixed the one miss: a brief passing shower early Saturday morning was described as likely to push the river toward runnable. The analysis now recognizes a short rain band with nothing behind it and says so — "not enough to change the river much."
Not user-facing, recorded for completeness: the card's AI calls now wait longer before giving up when the inference server is busy with the nightly Buffalo study analysis (the cause of a few carried-over narratives at midnight).
Version 2026.7.11.2 — July 11, 2026
The Ponca AI analysis now tells a continuous story instead of a series of hot takes.
- Each 15-minute update of the "AI Rainfall Event Analysis" card now knows what its previous note said, so the story carries forward instead of swinging between takes — when the picture changes, the card says so plainly ("the extra rain never materialized") rather than silently reversing itself.
- The note now usually ends with when to check back — "keep an eye on it as this next batch of rain falls" — instead of leaving you guessing.
- When radar shows meaningfully more rain inbound, the analysis adds historical perspective: what storms that ended up with that much total rain went on to do. Only appears when it actually changes the odds; still observation-based, and the official predictions remain untouched.
Version 2026.7.11.1 — July 11, 2026
The Ponca AI rain analysis now watches live radar while it's raining.
- The "AI Rainfall Event Analysis" card on the Buffalo page used to see only rain totals that update once an hour — so when a line of storms was bearing down on the Ponca creeks, the card couldn't know yet, and when the rain was wrapping up, it kept hedging. Now, while rain is falling, the analysis also reads the last 40 minutes of weather radar over the watershed: how hard it's raining right now, whether the storms are sweeping through or parked in place, and whether more rain is lined up behind. The written outlook can now say "this one's still building" or "this is about done" — often well before the hourly totals catch up. Experimental: radar is observation of rain actually falling, not a forecast.
- The official rise predictions and flood-risk numbers are unchanged — they still run only on rain that has already been measured. Radar informs the written analysis only.
Not user-facing, recorded for completeness: new ponca_radar_context.py cron on ScriptPi reading MRMS PrecipRate (2-minute radar rain-rate mosaics); radar context logged alongside each analysis for later self-grading on the scorecard pipeline; zero downloads in dry weather.
Version 2026.7.10.4 — July 10, 2026
New "Understand the Math" page: how the neural net actually works.
- "Neural net" joins the math links on the Buffalo page. For the technically curious: what a neural network really is (no mystique — weighted sums, a squash function, and 138,610 learned numbers), how ours reads 48 hours of radar like a movie while watching the gauges respond, how it was trained and honestly validated on twelve years of storms, and the full lab notebook — all nine experiments, including the five that failed and what each failure taught us. Ends with the exact numbers the shipped model carries and the reasons not to over-trust it. Linked from the Buffalo header and from the bottom of the Neural Net Predictions page.
Version 2026.7.10.3 — July 10, 2026
The Neural Net Predictions now grade themselves on the public scorecard.
- New section on the Prediction Scorecard page: every hourly Neural Net prediction is now recorded and, once the hours it predicted have passed, graded against what the gauges actually did — average error, how often the likely range contained the truth, and skill versus simply assuming the level won't change. Numbers will fill in over the coming days and become meaningful once the river actually moves. Same honesty rule as every other predictor on the page: the grades are computed automatically, good or bad.
Version 2026.7.10.2 — July 10, 2026
The Neural Net Predictions page is now linked from the Buffalo River dashboard.
- New button on the Buffalo page: next to Buffalo TV you'll now find "🧠 Neural Net Predictions" — the experimental hour-by-hour level projections for Ponca and Boxley released earlier today (see 2026.7.10.1 below). Same page, now one tap away instead of hidden.
Version 2026.7.10.1 — July 10, 2026
New (experimental): hour-by-hour Neural Net Predictions for Ponca and Boxley.
- A new experimental page predicts the next few hours at the two headwater gauges. At
/buffalo/neural-net-predictions/, a small neural network — trained on 12 years of storms — watches the last 48 hours of radar rainfall over every square kilometer above the Ponca and Boxley gauges, plus the gauges' own recent behavior, and projects the level hour by hour: six hours ahead at Ponca, four at Boxley (its smaller basin gives the radar less lead time). Each hour shows the model's best estimate and a likely range, with high-water and flood coloring. - These projections use only rain that has already fallen — never a forecast. If more rain comes, the numbers become a floor, not a ceiling; the page refreshes every hour as new radar arrives.
- It's experimental and deliberately tucked away (not yet linked from the main Buffalo page). Trust the main dashboard and your own judgment first, and expect this page to evolve.
Not user-facing, recorded for completeness: the model (pixel-v5) trains on a dedicated GPU machine but serves from the existing prediction Pi as a 530 KB pure-numpy engine, parity-tested against the trained network; hourly cron, isolated from all other site systems; honest "stale/degraded/offline" banners when inputs are missing.
Version 2026.7.9.1 — July 9, 2026
New: Buffalo TV — a full-screen, self-updating view of the whole river.
- A "Buffalo TV" button is now on the Buffalo River page. Up top, alongside the "Understand the math" links, there's a new Buffalo TV button. It opens a full-screen, self-refreshing display of all seven gauges and current watershed conditions at a glance — the mainstem colored by whether each stretch is floatable right now, live rainfall shaded on the map, and any inbound rise or flood forecasts. It's built to live on a wall-mounted screen at an outfitter or visitor center, or to run full-screen on your own monitor while you plan a trip; leave it up and it keeps itself current. (Experimental — always verify conditions before you go, and it's not an official NPS or USGS product.)
Not user-facing, recorded for completeness: the long-soft-launched /buffalo/tv/ kiosk page (disk-read, no restart) is now linked from the Buffalo header via an inline-styled pill button in dashboard.py. The /buffalo/simulator/ page was renamed "Buffalo National River Simulator" (test-tube icon removed, EXPERIMENTAL WHAT-IF TOOL banner kept) but remains unlinked and noindex — staged for a later launch.
Version 2026.7.7.4 — July 7, 2026
Ground-dryness alerting extended to 13 more drainages.
- The neighboring drainages now borrow a calibrated gauge for their dryness read. This morning's update gave Upper Buffalo, Richland Main, and Upper Cossatot thresholds that adjust to how dry the ground is, read from their own gauges. Tonight the surrounding drainages join in: the Buffalo-family creeks (Adkins, Boen Gulf, Beech), the Little Buffalo family (EFLB, West Fork Shop, Thomas), the Kings family (Upper Kings, Osage), the Richland tributaries (Falling Water, Big and Long Devils, Bobtail), and Baker Creek each read the nearest calibrated gauge — Boxley, Richland, or the Cossatot — as a regional ground-moisture indicator, with the threshold scaled up for each creek's smaller, flashier watershed. The Detail column shows the reasoning, e.g. "43% of 1.90" trigger (Cossatot DAMP × 2.0)".
- These are watches, not forecasts. Unlike the three gauge-calibrated drainages, these thresholds rest on a neighboring gauge plus local paddling knowledge — the reference gauge can be dry while a storm parks on one hollow. Treat them as a smarter heads-up, and expect the multipliers to get tuned as real storms test them. (Experimental.)
- Spirits Creek, the Big Piney family, and the Kiamichi creeks keep the previous fixed-threshold system — no suitable reference gauge nearby yet.
Not user-facing, recorded for completeness: q_ref: {parent, multiplier} blocks on 13 drainages in drainages.yaml; assembler scales the parent's Q-bucket threshold and keeps each drainage's own rolling rain window; per-cycle legacy fallback; Tier-2 decisions dual-logged with tier: 2; multipliers = Dave's May 2026 numbers for six creeks, pattern-derived (confirmed) for seven.
Version 2026.7.7.3 — July 7, 2026
Watershed alerts now know how dry the ground is — using the creek itself as the moisture gauge.
- Smarter alert thresholds for Upper Buffalo, Richland Main, and Upper Cossatot. How much rain it takes to bring a creek up depends enormously on the season: 1.5" on saturated February ground can mean a great run, while the same storm in July soaks into dry dirt and the creek barely moves. The Watersheds page previously used one fixed rain trigger with a small seasonal adjustment — which is why last night's 1.5" storm fired a Richland watch even though the creek was dead low and barely budged. These three drainages now read their own USGS gauge as a ground-dryness indicator: a dead-low Richland demands over 2" of storm rain before alerting, while an already-flowing Richland alerts on as little as 0.55". The thresholds were calibrated against 11+ years of radar rainfall and gauge history, and in a wet-season backtest this method caught 11 of 11 boatable rises (the old scheme caught 6) with roughly 3–4 hours more warning. (Experimental — first dry-season deployment; thresholds will be reviewed as real storms come through.)
- The Trigger column now shows what the current threshold is and why. For these three drainages you'll see the rain amount adjust as the creek's flow changes, marked "/ event" (rain accumulated over the current storm) instead of a fixed time window, with the reasoning spelled out in the Detail column — e.g. "No active rain event — Q 25 cfs (DRY: needs 1.05")".
- The other drainages (no usable gauge on the creek) keep the existing fixed-threshold system for now.
Not user-facing, recorded for completeness: v2 Q-bucket engine (qbucket_shadow.py, hardcoded calibration) promoted from a clean 12-day shadow run to authoritative in assemble_and_push.py with per-cycle legacy fallback; legacy status still computed and dual-logged to logs/qbucket_shadow.log; suppress-while-already-running maps to NO_ALERT; post-promotion checkup reminder 2026-07-25; research in research/q_bucket_triggers/ and research/q_bucket_recent_backtest/.
Version 2026.7.5.5 — July 5, 2026
Smarter Buffalo flood warnings: creek-driven floods, cloudburst detection, and all-time-record context.
- Warnings when the creeks flood first. Some Buffalo floods start on Richland Creek or Bear Creek — one hollow gets hammered while the rest of the basin stays dry, and the main river doesn't react until the creek's water arrives. The wave forecaster now launches an arrival forecast the moment either creek starts a major rise. In a March 2024 storm of exactly this shape, the Buffalo at St. Joe jumped from 326 to 14,500 cfs nine hours after Richland crested — warnings for that kind of event now begin while the creek is still rising. (Experimental.)
- Cloudburst detector. Gauge cards now flag "Locally Intense Rain" when a single sub-watershed takes 2"+ in 24 hours — the concentrated storms that basin-wide rainfall averages hide. In twelve years of radar data, about four out of five of these flags were followed by a real rise downstream within 36 hours. (Experimental.)
- All-time-record context on wave forecasts. When a big wave is inbound, the forecast now shows how the predicted crest compares to the all-time record at that gauge (records reach back to 1915 at St. Joe), with a clear callout if a wave approaches record territory. Forecast bands also no longer display above just-past-record levels.
Not user-facing, recorded for completeness: trib-launch reach models (Richland→St. Joe, Bear Creek→Harriet; LOYO-banded, fit on 268/300 paired events) added to the wave router as pure data — no router code changed; per-zone max-HUC12 rainfall stats added to the data feed; the Buffalo Simulator engine/bundle updated in lockstep (golden gate 1,800/1,800); research in research/buffalo_sim/envelope/ and research/trib_launch_waves/.
Version 2026.7.2.10 — July 2, 2026
Buffalo page: recession countdowns now know what season it is.
- Seasonal settle levels. The level a river falls toward swings enormously with the calendar — St. Joe typically holds above ~600 cfs in March but drops to ~50 by September. Countdowns used to chase one flat year-round floor, promising spring drops the river wouldn't deliver (in an 11½-year backtest, targets below the month's typical floor were reached within 10 days only 5–16% of the time). Countdowns to below-the-floor levels now say "typically settles near ~X cfs this time of year" instead of a number that won't come true.
- And an honest null result, published on the math page: the paddler folklore that water drops faster in summer is TRUE — we measured 1.2–2.3× faster in matched conditions (the trees really are drinking the river). But adding a calendar rule to the countdowns made them worse in backtest, because the system already measures each recession's actual speed live and adapts. The folklore is confirmed; the fix was already built in.
Not user-facing, recorded for completeness: monthly p15 floors (circularly smoothed) for Pruitt/St. Joe/Harriet in config recession_floor_monthly (Boxley/Ponca floors never bind their thresholds); seasonal rate multipliers fit and backtested in two variants (result-scaling and anchor-recentering), both regressed vs the live k_now anchor — not shipped; full analysis in research/buffalo_replay outputs/RECESSION_SEASONALITY_REPORT.md.
Version 2026.7.2.9 — July 2, 2026
Buffalo page: the Ponca AI card explained, and recession math corrections.
- New math page: "The Ponca AI card, explained" (in the Understand-the-math menu). The full anatomy of the orange card: the 394-storm analog library and its four outcome classes, the three honesty rules on the matching, the physics floors that override the statistics, and — most importantly — what the AI actually does: every number is computed by transparent math first; the language model only writes the sentences and cannot change the call.
- Recession page corrected. The per-gauge fall-rate table had a lookup bug: Ponca showed the same rate at high and low water, and St. Joe/Harriet showed nothing. Real numbers now — e.g., Boxley sheds ~89% of its flow per day from high water but only ~40% near floatable; St. Joe and Harriet now display their rates plus the baseflow they settle toward.
Not user-facing, recorded for completeness: recession page now imports the deployed curve module directly for lookups (raw-Q bands, edge fallback) so it cannot mis-render again. Separately measured this session, pending review before any model change: paddler folklore confirmed — summer recessions run 1.2–2.3× faster than winter in matched flow bands (evapotranspiration), and lower-gauge baseflow swings seasonally (~600 cfs March vs ~50 September at St. Joe against a flat 76 in config); plan at RECESSION_SEASONALITY_PLAN.md.
Version 2026.7.2.8 — July 2, 2026
Buffalo page: the full math behind every prediction, published.
- A new "Understand the math" menu at the top of the Buffalo dashboard links five explanation pages. Nothing is hidden — actual equations, coefficients, thresholds, and measured hit rates, because transparency on public safety builds trust:
- Horizons — how far ahead the system can see at each gauge (shipped earlier today).
- Wave tracker — the real per-reach equations that turn an upstream crest into a downstream forecast, travel-time tables by wave size, how watches/warnings are defined, and how the tracker corrects itself as a wave passes each gauge.
- Local rain — the exact trigger thresholds per gauge, how the river's own baseflow tunes them for ground wetness (with the fizzle-rate proof), and the four rules that make a prediction stand down.
- Recession — the measured decay curves behind "time to floatable" (how fast each gauge actually falls at every flow level) and when a countdown pauses.
- Confidence — every high/medium/low label is a measured historical hit rate, and this page shows the actual table, sample sizes included.
Not user-facing, recorded for completeness: pages generated from deployed model artifacts by build_math_pages.py (they cannot drift from the running code; rebuild + scp on model changes, no restart); confidence labels read from the live CONFIDENCE_TABLE; horizons page corrected same-day to baseline v6 + baseflow ground-wetness copy after an accuracy audit.
Version 2026.7.2.7 — July 2, 2026
New page: "How far ahead can this system see?" — the honest math behind Buffalo predictions.
- A new page at /buffalo/horizons/ (linked from the top of the Buffalo dashboard) lays out, gauge by gauge, what warning time this system can honestly give and how often it's right — measured by replaying our prediction code against 11½ years of river history. Boxley and Ponca are rain-driven gauges: expect roughly 5 hours from the flood-making storm's first signal, physics-capped. Pruitt, St. Joe, and Harriet ride the wave trackers: typically 6–10 hours of watch before high water, with 91–98% of floods caught.
- It also says what we can miss — each gauge card names its blind spot plainly, because knowing the limits of a forecast is part of the forecast.
- The page includes the river-chain travel times (how long a surge takes from each gauge to the next) and a plain-English explanation of what a watch and a warning actually mean here.
Not user-facing, recorded for completeness: page content generated from the replay baseline artifacts by build_horizon_page.py (regenerated on model changes; the route serves a static fragment — scp updates, no restart); buffalo_horizons.json published alongside as machine-readable model facts (groundwork for a future what-if simulator). Lead metrics use causal-run semantics (the unbroken prediction streak into the crossing) after operator review caught the prior-pulse inflation in the draft.
Version 2026.7.2.6 — July 2, 2026
Buffalo page: the river itself now tells the system how wet the ground is.
- Ground wetness is now read from the river, not just the rain gauge. Rise predictions scale their triggers by how primed the ground is. That used to come only from the past week's rainfall — but a week of no rain after a soaking month leaves the ground far wetter than the rain total suggests. The system now reads each gauge's pre-storm baseflow against 11½ years of history for that month: high baseflow for the season means saturated ground and a hair-trigger river. In replay this caught 5–9% more real rises with no extra false alarms — the storms the old "dry" label caused it to shrug off.
- You'll see it in the prediction reasons: "on wet ground (river at 92nd pct)" instead of a rain-total figure, when the river data supports it.
Not user-facing, recorded for completeness: soil-moisture ladder rung 1 (pre-storm baseflow percentile, month-conditioned, 6–12h lagged against self-wetting; rain-antecedent remains the fallback); NLDAS-2/SPoRT-LIS rungs skipped (no data access, and the river signal may well be the better sensor anyway); replay baseline promoted to v6.
Version 2026.7.2.5 — July 2, 2026
Buffalo page: recession countdowns stay on screen unless a rise is genuinely imminent.
- "Time to floatable / too low" countdowns no longer vanish because of far-away predictions. The countdowns used to hide whenever any rise was predicted anywhere upstream — even a minor blip two gauges up with the water still 14 hours away. In an 11½-year replay, 97–99% of those blackouts saw no rise within six hours. Countdowns now pause only when a rise is expected at your gauge soon: local rain building there, or a tracked wave arriving within about 3 hours — and when a wave is further out, you'll see both the countdown and the incoming-wave forecast together, which is the honest picture.
Not user-facing, recorded for completeness: post-audit follow-on — arrival-aware suppression gate (rise_imminent_at) replacing has_upstream_rise; measured on the full replay before deployment (~104 restored countdown-hours/yr, bad-shows +2/yr all during hours the system had no signal anyway).
Version 2026.7.2.4 — July 2, 2026
Buffalo page: steadier behavior during radar and data outages.
- Predictions can no longer get stuck during a radar outage. If the rainfall feed goes down mid-storm, frozen rain totals used to keep "rise expected" cards alive indefinitely; the system now recognizes stale data and lets predictions expire on their normal schedule.
- Missed radar hours heal themselves. If the rainfall reader misses an hour, it now recovers it automatically from the archive instead of losing it forever — so rain totals and ground-wetness readings stay accurate through hiccups.
- The Ponca analysis card stands down gracefully when its data source goes stale, instead of freezing its last message on the page.
Not user-facing, recorded for completeness: fix package F6 (audit finding #14 + #15a) — wall-clock QPE windows, snapshot backfill, staleness surfaced to consumers, MRMS sentinel counter, clock-skew guards, fsync on state files, flood-threshold boundary classification; 19 synthetic outage/gap/skew tests. This completes the 2026-07-01 fresh-eyes audit: all six fix packages (F1–F6) are now live.
Version 2026.7.2.3 — July 2, 2026
Buffalo page: smarter local rain triggers, honest timing windows, and Bear Creek finally counts.
- Rise predictions now key off rain intensity, not stale accumulation. The old trigger couldn't tell 2 inches in 3 hours from 2 inches dribbled over a day. Predictions now fire on real short-burst intensity (with a separate very-heavy-soaker trigger on the lower river), which roughly doubles how often a fired prediction verifies. Thresholds were tuned per gauge against 11½ years of history.
- Each gauge now predicts on its own honest clock. Timing windows are measured from how each basin actually responds — Boxley peaks 5–10 hours after rain starts, Harriet's middle-basin storms take 9–20 — and the window is set when the event starts and counts down, instead of resetting every 15 minutes.
- Rain over Bear Creek now counts toward Harriet. Over a third of the drainage between Grinder Ferry and Harriet drains through Bear Creek, and its rain previously fed nothing. It's now part of Harriet's local rise and flood-risk signal, and the Richland/Bear Creek signal gauges show real trend arrows instead of "—".
- The wave tracker and local predictions now divide the work. When a wave is already tracked inbound (the usual case on the lower river), the gauge card shows the wave forecast — arrival window and size — instead of a vaguer local-rain guess. Local rain cards now appear mainly for the storms the wave tracker can't see coming: rain concentrated over the middle basin. Their confidence labels are freshly calibrated, so a "medium" or "low" tag means exactly that.
Not user-facing, recorded for completeness: fix package F5 complete (findings #5, #8, #10 from the 2026-07-01 audit) — per-gauge intensity/accumulation trigger ladders (leave-one-year-out fit), measured first-fire→peak windows frozen at event anchor, tributary-zone blending, router-jurisdiction handoff, scale-aware fizzle cuts, recalibrated confidence table; five candidate iterations against the replay gate before deployment; replay baseline promoted to v5. Remaining audit package: F6 (robustness).
Version 2026.7.2.2 — July 2, 2026
Buffalo page: rise predictions now stand down once the rise they predicted has happened.
- No more phantom "rise coming" cards on a falling river. Rise predictions used to run on a rain timer — after a storm, a card could keep saying "rise expected in 2–6 hours" for hours after the river had already crested and was clearly dropping. Predictions now watch the gauge itself: once the predicted rise has arrived and the river turns down, the card clears. If fresh rain keeps falling, the system can still call a genuine second rise — but it has to be a real new rise from the river's current level, not an echo of the last one.
- What you'll notice: rise prediction cards disappear sooner after a storm peaks, and the ones you do see are right more often — in an 11½-year replay, predictions verified better at every gauge, with Boxley improving the most. No flood detection was lost anywhere.
- Recession countdowns come back sooner. Because stale predictions no longer linger, the "time to floatable/too low" countdowns — which pause while a rise is expected — resume hours earlier after a storm.
Not user-facing, recorded for completeness: fix package F5.1 from the 2026-07-01 audit (prediction-consumed event state in local_rain_state; post-peak prediction-hours −88% in replay, flood POD byte-identical); gated on a full 2014–2026 replay before deployment; replay baseline promoted to v4. F5.2–.4 (intensity/accumulation split, measured windows, tributary zones) pending.
Version 2026.7.2.1 — July 2, 2026
Buffalo page: the river now tracks flood waves as they travel downstream — with predicted size and arrival time.
- New "Incoming Wave" section on the Buffalo gauge cards (experimental). When a surge crests at an upstream gauge, downstream cards now show what's coming: a predicted flow range (for example "~8,400–11,900 cfs") and an arrival window in local time. The forecast appears while the upstream gauge is still rising (marked "still growing"), firms up when it crests, and stays on screen until the wave actually arrives — it no longer vanishes the moment the upstream gauge starts dropping, which used to happen hours before the water reached you.
- Smarter wave alerts. The alert banner now fires based on how big the wave will be at the gauge you care about, not whether some upstream gauge happened to cross its own flood line. A "watch" means the predicted crest reaches at least 60% of that gauge's flood threshold; a "warning" means even the conservative end of the prediction floods. In an 11½-year replay, this caught 96–98% of St. Joe and Harriet floods with a typical 10 hours of notice — roughly double the old lead time — and near-miss waves that used to be invisible now get a watch.
- Lower Buffalo paddlers and NPS gravel-bar users benefit most: Harriet, which used to get under 5 hours of warning (and sometimes none at all), now typically sees a wave coming 10+ hours out, tracked all the way down the chain from Ponca and Pruitt.
Not user-facing, recorded for completeness: fix package F4 from the 2026-07-01 audit — per-reach crest and travel-time models fit on an 11.6-year event library (leave-one-year-out validated), a stateful wave tracker replacing the trend-gated single-hop mechanism, target-anchored alert tiers tuned on the full replay (all deploy gates passed vs baseline v3), Richland/Bear Creek gauges now feed the lower-reach predictions. Packages F5–F6 pending.
Version 2026.7.1.9 — July 1, 2026
Buffalo page: rise predictions now judge storms against how wet the ground was before the rain.
- "Antecedent" now means what it says. The Buffalo page's rise predictions and flood-risk levels scale their rain thresholds by ground wetness — dry ground soaks up rain that saturated ground sheds. A long-standing bug let the storm being measured count toward its own "prior wetness," so the system almost always judged storms as falling on wet ground and could lower its own bar mid-storm. It now measures the week of rain before the last 24 hours.
- What you'll notice: somewhat fewer rise predictions overall — mostly the ones that didn't pan out. In an 11½-year replay, predictions that a rise was coming verified more often at every gauge, and "large rise" calls at Harriet that actually approached flood went from 79% to 90%. Dry-ground conditions (common in late summer) are now genuinely recognized for the first time, so a modest storm after a dry stretch is less likely to trigger a rise call the river shrugs off.
- The heavy-rain flood-risk banner gets rarer and more meaningful — roughly 3 episodes a year instead of 9, because it no longer fires on storms that made their own ground look wet.
Not user-facing, recorded for completeness: fix package F3 from the 2026-07-01 audit (pre-storm antecedent, precip_7day_total_in preserved for the propagation model's fitted definition, all 8 zones exported incl. Richland); gated on a full 2014–2026 replay before deployment (St. Joe flood detection unchanged, no Boxley/Ponca regression); replay-rig baseline promoted to v3. Packages F4–F6 pending.
Version 2026.7.1.8 — July 1, 2026
Buffalo page: the downstream "river rise" card now stays up until the wave actually arrives — and won't inflate its numbers late in an event.
- The "AI River Rise & Propagation" card no longer disappears before the surge reaches St. Joe / Grinder Ferry. It used to stand down once rain ended — often 6+ hours before the wave arrived downstream. It now stays up until the water has had time to reach Grinder Ferry, through the whole arrival window.
- Its downstream crest estimates hold steady through an event instead of drifting. The card now locks in the storm's rainfall picture and the pre-storm ground wetness when an event starts, the same way its prediction model was calibrated. Before, re-reading decaying rainfall mid-event could quietly inflate the St. Joe estimate — on a replay of the November 2024 record flood, the old readings would have called ~164,000 cfs at Grinder Ferry when ~71,000 actually came; the corrected inputs call ~60,000–85,000. Experimental, as always.
- No more multi-thousand-cfs "crests" from drizzle. On ordinary wet-season days with a bit of rain and normal flows, the card now says plainly that downstream will see little change, instead of quoting a precise crest from a model being used outside its comfort zone.
- Honest wording when the upper river has crested: the card now says Boxley "crested and is now dropping — its surge is already on the way downstream" instead of claiming it's still climbing.
Not user-facing, recorded for completeness: this is fix package F2 from the 2026-07-01 fresh-eyes audit (event-frozen SJ_MODEL features + pre-storm antecedent + wave-in-transit hold + fit-domain gate); validated over 173 historical Ponca events (antecedent error vs fit: +1.63″ → +0.17″ median on big events; late-event regime flips 38% → 3.5%) plus a live end-to-end synthetic flood test. Packages F3–F6 pending.
Version 2026.7.1.7 — July 1, 2026
Buffalo page: an earlier flood-risk banner, and confidence labels you can take at face value.
- A new heavy-rain flood-risk banner (amber = watch, red = warning) now appears on the Buffalo page when a lot of rain has fallen on a gauge's watershed but no gauge has flooded yet — the early-warning step before the red "gauge is in Flood" banners you've seen during events. A display bug had kept this banner from ever appearing; expect it a handful of times a year, during real storms. Experimental: it's rain-based, so it will sometimes warn on a storm the river ends up shrugging off.
- The small per-gauge "Flood Risk: WATCH" note now shows in amber (and WARNING in red) as intended — WATCH had been rendering in red.
- Rise-prediction confidence labels are now honest. The "(high/medium/low)" next to each Buffalo rise prediction is now calibrated against 11½ years of actual gauge outcomes — "high" now means predictions like this one verified at least ~65% of the time historically. The old rule could label weak signals "high"; some predictions that used to read "high confidence" will now honestly read "low."
Not user-facing, recorded for completeness: rise predictions are now graded against the timing window of the driver that set the category (grader + replay-rig change, removes ~6 pts of unearned timing credit from the accuracy baseline); antecedent tier boundaries are read from config instead of being hardcoded; this ships fix package F1 from the 2026-07-01 fresh-eyes audit of the Buffalo prediction chain (research/buffalo_replay/outputs/FRESH_EYES_AUDIT.md) — packages F2–F6 pending.
Version 2026.7.1.4 — July 1, 2026
The site is faster, and the Illinois River forecast card is now complete.
- Pages load noticeably faster. The home page, changelog, and guide now respond several times quicker, and the site stays responsive when many people check it at once during a rain event.
- The Illinois River page's Empirical Forecast card now shows the full detail table — per-tier chance, rainfall band, and historical rain percentiles — like every other basin. (Its "rise to floatable" row honestly reads insufficient data: the Illinois at Hwy 16 has dropped below 150 cfs only a handful of times in 12 years.) Experimental, as always.
- The Illinois empirical forecast now records its predictions for grading. Its accuracy will start appearing on the Scorecard page as forecasts settle over the coming days — closing a gap where the newest basin was the only one not checking its own work.
Not user-facing, recorded for completeness: USGS gauge fetching was consolidated into batched requests (~93% fewer API calls per 15-min cycle, with per-site retry fallback preserved); the per-basin script clones for Mulberry, Big Piney, Cossatot, and Richland now run through one shared library (/home/dave/basinlib/ shims — equivalence-verified before deploy) with a retry hardening all four inherit; a git baseline of both Pis' code/config now lives on the operator harness (creekintelligence/mirrors/); the dashboard gained an mtime-keyed file cache, explicit Cache-Control headers, and a threaded gunicorn worker (-w 1 --threads 4). See ARCHITECTURE 2026.7.1.4.
Version 2026.7.1.2 — July 1, 2026
The Buffalo River Watershed Study has wrapped up after 122 days — a month longer than planned — and its page is now a finished, browsable archive.
- The Buffalo Study page (linked from the tools menu) now opens with a short "Study concluded" summary of what the 122-day experiment learned: how the same inch of rain moves the river much more when the ground is already wet, how the upstream-to-downstream cascade is timed (about 10 hours St. Joe→Harriet), each gauge's personality, and the record June 22 flash flood that anchored the extreme end. (The study ran an unusually wet June a full month past its planned 90 days — that wet stretch delivered its most valuable data.)
- The daily archive and the final hypothesis document are still fully browsable — now clearly marked as a frozen record rather than a live-updating one.
- Nothing you rely on for live conditions changes. The study's findings were folded into the everyday forecasts (watershed alerts, rise likelihoods, downstream propagation), and those keep running exactly as before.
Not user-facing, recorded for completeness: the study's nightly Claude Opus narrative stream was retired on 2026-07-01 (cron study_daily_analysis.py --no-opus), ending the project's only per-night external API cost; the local qwen3.6:27b stream continues a no-cost nightly pulse on ScriptPi for periodic hand-review. /study/ pages are frozen at Day 122 (June 30, 2026); the concluded banner + per-page frozen-archive notes are served from dashboard.py (study_index/study_hypothesis/study_daily). See ARCHITECTURE §4.7 + §16 item 16 (version 2026.7.1.2).
Version 2026.7.1.1 — July 1, 2026
Arkansas Creek Intelligence has its own web address now: arcreekintel.com.
- The site now lives at its own dedicated domain — arcreekintel.com. Every page is reachable there: the home creek list, the individual creek and watershed pages, the historical reports, and the scorecard — all of it, exactly as before, just at a shorter address that's all about the creeks.
- Your existing bookmarks still work. The old web address keeps pointing to the very same site during the transition, so nothing you've saved will break. Going forward, arcreekintel.com is the one to save and share.
Version 2026.6.30.1 — June 30, 2026
New page: the Illinois River and the Upper Illinois Water Trail.
- There's now a dedicated page for the Illinois River at /illinois/. It tracks the Hwy 16 gauge near Siloam Springs for the 15.5-mile Upper Illinois Water Trail (Chamber Springs → WOKA), with float levels — too low under 150 cfs, low-but-floatable 150–250, optimal 250–2,500, above-recommended over 2,500. (Those bands come from the local paddling community; the AGFC's official 200–1,000 cfs range is noted on the page too.)
- The Upper Illinois Water Trail also shows as a live creek card on the home page and the gauges list, with its current float level — so it's an official entry in the creek lineup, not just a standalone page.
- Upstream gauges give you a head start. Because the Illinois drains a big watershed, the page also watches the gauges on Osage Creek (at Elm Springs and Cave Springs) and at Savoy — they typically come up several hours before that water reaches the trail, so a bump upstream is your early warning. The downstream Watts, OK gauge (below WOKA) gets its own card and 24-hour graph as well.
- A watershed rainfall map and forecast. Rainfall is broken out sub-basin by sub-basin, above and below Hwy 16, each with a 24-hour rain-forecast column, plus an experimental "chance the river rises" forecast for the run. (Experimental.)
- A "⚠ heavy rain below Hwy 16" caution for the rare storm that soaks the lower river toward WOKA without showing up on the Hwy 16 decision gauge.
- A new historical page at /illinois/historical/ — how much of the year the river spends in each float range (it sits in "optimal" about 62% of the time), the biggest floods on record (April 2017 peaked at 148,750 cfs), and a catalog of all 350 storms that have pushed it past 1,000 cfs over the last 23 years, with the rainfall behind each recent one.
Not user-facing, recorded for completeness: new ScriptPi basin /home/dave/illinois/ (config + assembler + multi-gauge fetch / read-qpe / weather+QPF, cloned from Big Piney with Buffalo's signal_for multi-gauge pattern grafted on), cron every 15 min → illinois_output.json. Full history collected to the harness research/illinois_*: 8 USGS gauges' complete records + hourly MRMS per-HUC12 QPE 2014→present over the 21 HUC12s above Watts. Empirical illinois_below block trained on the above-Hwy-16 basin (calibrated_table.json + lookup index + empirical_config.yaml). Upstream→Hwy-16 propagation lags from storm-pulse cross-correlation (Savoy 6–8 h, Osage 8–13 h, Mud 11–16 h; Watts +3–5 h downstream). New DMZPi routes /illinois/ + /illinois/historical/. See ARCHITECTURE §4.9c (version 2026.6.30.1).
Version 2026.6.29.7 — June 29, 2026
The rainfall forecast on the five creek pages now gives you an honest percentage instead of a vague "rise likely."
- On the Cossatot, Richland, Hailstone, Mulberry, and Big Piney pages, the Empirical Forecast now reads like "~30% chance of rising to floatable in the next 6–12 hours" instead of a yes/no "WATCH — rise likely." The old version cried wolf: across 2,314 real rainstorms back to 2014, its "rise likely" was a false alarm 60% of the time. The new number is calibrated against what the creek actually did — and it holds up every year.
- When the new forecast says a number, the creek does it about that often:
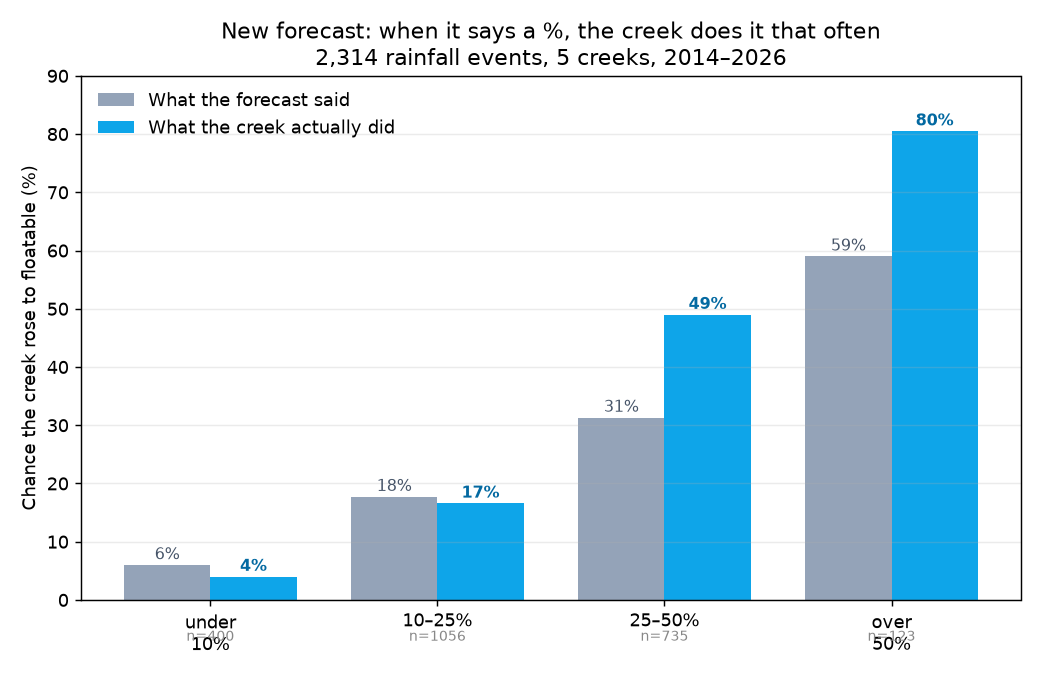
- Why it's better: the old engine only knew how much rain usually fell before a creek came up — it never learned how often that same rain just soaked in and did nothing. The new one knows both, so a heavy rain that usually drains is reported as the modest chance it really is, not a false alarm. It also quietly leans a little higher when the ground is already saturated and lower in a dry spell. (Experimental — it's an honest probability, not a guarantee: a 30% morning can still come up, and an 80% one can still fizzle.)
Not user-facing, recorded for completeness: new calibrated engine (empirical_forecast/calibrated.py + calibrated_table.json — denominator-corrected P(rise | rain, soil) over the full 2014-2026 MRMS+USGS record) feeds the headline in empirical_predict.py, with a per-basin warm rolling factor off the local settled archives. Boxley (no page) unchanged; empirical stays off Facebook per standing choice (Watersheds only). Full research + validation in the harness research/empirical_recalibration/ (REPORT.md). ARCHITECTURE §4.13/§16-11 updated.
Version 2026.6.29.6 — June 29, 2026
Added a privacy policy page.
- There's now a privacy policy at /privacy. The short version: you can use the site without an account or handing us any personal information; we run no ads, no analytics of our own, and never sell anyone's data. It's there so our (minimal) information practices are documented in one place — and so the Facebook page can link to a real policy.
Version 2026.6.29.5 — June 29, 2026
Our forecast "report card" got clearer and more honest, and a couple of predictions were tuned based on what it's been telling us.
- The Scorecard page (
/scorecard) is easier to read and harder to mislead. The recession-countdown table now hides the dozens of barely-started rows so you only see the gauges with enough data to mean something, and each predictor's "bias" now shows its average and its typical (median) miss side by side — so a single freak event (like the June 22 flash flood) no longer makes an otherwise-solid predictor look broken. (Experimental, self-grading page.) - The Buffalo "AI Rainfall Event Analysis" card now stands down as the river falls. Once the Ponca gauge is clearly past its crest and dropping, the card eases its flood-risk number and wording back down instead of staying pinned near "Flood" through the recession — so it stops over-warning about water that's already on its way out. (Experimental.)
- Big Piney's "Above Longpool" run no longer shows a "time to too low" countdown that never panned out. That upper Class II+ stretch settles so close to its too-low mark that the countdown to it was unreliable, so we've switched it off for that section — the "low but floatable" and "optimal" countdowns there are unchanged.
Not user-facing, recorded for completeness: this came out of the weekly scorecard / Signal-digest review. score_all.py now emits a per-predictor median error, min-n-gates the recession rows (MIN_RECESSION_GRADED), and adds a recession timing-bias flag; ponca_analog.py decays the dominant-driver flood-floor toward the raw k-NN once Ponca is past crest (raw values still logged for backtest); big_piney_assemble.py had recession_baseline support restored to its ported compute_recession (the port had dropped it) and above_longpool was given recession_baseline: 2.0. The empirical engine's over-warning (also visible on the scorecard) is a deeper rebuild blocked on an offline tool — tracked, not yet changed. See ARCHITECTURE §4.13 / §16-11 (version 2026.6.29.5).
Version 2026.6.29.4 — June 29, 2026
Creek Intelligence is now on Facebook — follow Arkansas Creek Intelligence for automatic creek alerts and a weekend forecast.
- We launched an Arkansas Creek Intelligence Facebook page, and it updates itself. When watersheds start coming up after rain, an alert bot posts a watershed alert to the page automatically — every creek crossing into Watch, Warning, or Flood that hour bundled into a single post, so you get one clean heads-up instead of a stream of notifications. It only speaks up when something new is developing or getting worse, so the page stays quiet between events. (Experimental — our Signal alert group is still the fastest, real-time channel.)
- New Weekend Creek Forecast, every Friday at 3 PM. A single post for weekend paddlers: the creeks running optimal right now that should still be runnable through the weekend (based on how fast each one is dropping), a short list of marginal "catch-it-early" runs, and a heads-up on any rain headed our way in the next 24 hours. (Experimental.)
- Why a Facebook page: it puts the same intelligence the dashboard already computes in front of paddlers where they already are — the alerts come to you, no page to keep checking.
Not user-facing, recorded for completeness: new creek-social toolset on the harness server — creek_social.py mirrors the watershed alerts to Facebook (fully decoupled from ScriptPi: it reads the same predictor_output.json the dashboard already produces, replays the alert engine's new/escalation logic against its own state, and posts via the Facebook Graph API), weekend_forecast.py (Friday cron; recession-based "holds through the weekend" filter), and announce.py (auto-posts a short feature announcement to the page whenever we ship a user-facing change — a new shipping convention now in CLAUDE.md §8 + ARCHITECTURE §4.2). Posts are deliberately link-free and bot-signed.
Version 2026.6.29.2 — June 29, 2026
The Buffalo Study pages now correctly report the June 22 flash flood — it had been mistakenly logged as a "data gap"
- On the experimental Buffalo Study pages (
/study/), June 22 is now described accurately as the biggest event of the study so far: a dry-ground flash flood that set records up in the headwaters — Boxley, Ponca, and Pruitt all hit study-record levels — then faded to just below flood stage by the time it reached St. Joe / Grinder Ferry. The running write-up had previously called this stretch a "data gap" and guessed it was only a moderate event, because the night-of analysis that captured the flood never made it into the rolling summary. Both the gap and the wrong guess are now corrected, with the real numbers. - Why it matters: it's the clearest example yet of a pattern these pages track — an upstream-only flood loses most of its punch crossing the dry middle of the watershed before it reaches the lower river (the same idea behind today's earlier propagation-card fix). Still experimental research pages, not the live gauges.
Not user-facing, recorded for completeness: two fixes to the nightly Buffalo Study analyzer (study_daily_analysis.py) plus a data backfill. (1) The transfer-ratio validator was QPE-gated — its 2,000 cfs/in cap had unconditionally false-rejected the model's correct 06-22 headwater numbers (Ponca 2,756 cfs/in matched the deterministic truth card), silently dropping that night's calibration; the cap now applies only on low-rainfall days, where the frame-override artifact it guards against actually occurs. (2) The Opus output cap was raised 40000→56000 after the daily+thinking+hypothesis rewrite pinned at the cap for five straight nights (06-21..06-25, incl. the flood), freezing the rolling hypothesis. (3) The 06-22 study-record flood was backfilled into both the qwen knowledge.md calibration tables and the Opus hypothesis.md (now live on /study/), from the truth card + the existing night-of Opus daily; logged in analysis/curation_audit.md. The qwen-only (--no-opus) cutover stays deferred — even post-fix, qwen still drops a gauge on the complex flood night. See ARCHITECTURE §4.7 + §16 item 16.
Version 2026.6.29.1 — June 29, 2026
More accurate downstream forecasts: the St. Joe / Grinder Ferry propagation card no longer overshoots when the rain falls up high
- The Buffalo page's "River Rise & Propagation Analysis" card now looks at where the rain actually fell before estimating how big St. Joe / Grinder Ferry will get. During the big June 22 flood the rain landed almost entirely up in the headwaters (around Boxley and Ponca), and the flood wave simply rolled downstream and faded — St. Joe ended up cresting right around its flood stage. The old card had assumed the rain fell across the whole watershed and forecast St. Joe two-to-three times too high — it read like a catastrophic flood when the river actually came up to about flood stage. That's the gap this release closes.
- What you'll notice: when a rise is concentrated up high and the middle of the watershed stays dry, the card now expects St. Joe to come up roughly in line with Ponca — the wave attenuates as it travels — instead of several times higher. When rain falls across the whole basin it still calls the big amplified crest, because that's when St. Joe genuinely does run several times above Ponca. Pruitt's forecast is unchanged (it was already accurate). Arrival-time estimates are a little tighter too.
- Still experimental — it's a downstream estimate given as a range, meant to help with gravel-bar timing; always check it against the live gauges.
Not user-facing, recorded for completeness: the St. Joe magnitude in ponca_analog.py build_propagation() was a fixed basin-wide amplification (≈2.9× Ponca) applied unconditionally; on an upper-concentrated event the wave routes through the dry 1,342 km² intervening basin and attenuates (~0.9×), so the constant over-predicted 2–4× (6-22: card 19–33k, actual 7.9k). Recalibrated against 152 historical Ponca events (2014–2026) from the local buffalo_huc_qpe + buffalo_gauges archives (research/buffalo_propagation_calibration/, with REPORT.md + figures). St. Joe is now a rainfall-distribution + antecedent conditioned log-linear model (SJ_MODEL) reading the upper-vs-intervening qpe_24hr ratio and the intervening 7-day antecedent — all already in buffalo_output.json — with a crest band floored at the routed wave (0.85×) and the reach's current flow. Leave-one-out CV cut the upper-concentrated bias from +46% to ≈0; out-of-sample on 6-22 it predicts St. Joe 8.5k–11.9k–16.9k (lower bound ≈ actual). Pruitt kept at ~1.13× (rain-insensitive, 11-yr confirmed); peak-to-peak lags re-derived. ScriptPi-only — render_propagation_card() reads only the kept crest-band fields, so no DMZPi change. See ARCHITECTURE §4.6 + §16 item 15.
Version 2026.6.24.8 — June 24, 2026
New: a 24-hour gauge chart on the Cossatot, Richland, and Hailstone pages
- Each of those three pages now shows a 24-hour hydrograph right under the big gauge reading — a simple line chart of the gauge's last 24 hours, so you can see at a glance whether it spiked and how it's receding, the way you would on the USGS site.
- The runnable range is shaded right into the chart (red = too low, yellow = low but floatable, green = optimal, blue = above recommended), so you can watch the river climb up into the good range and fall back out of it — not just a bare line. The peak is labeled and "now" is marked with a dot.
- It's a lightweight built-in chart (no third-party widgets) and fills in live as new readings come in every 15 minutes. When a creek is sitting below every threshold, it just reads all-red ("too low") with the trend visible.
Not user-facing, recorded for completeness: each physics-basin assembler now emits gauge.readings_24h (a [[epoch, value], …] array of the last 24 h, ~96 pts at 15-min) via a build_readings_24h() helper — Cossatot/Richland stitch yesterday+today's daily height files to span midnight, Hailstone uses its already-rolling cfs buffer from creeks/gauge_data.json. dashboard.py gained render_hydrograph(), an inline-SVG renderer (tier bands + line + peak + "now" dot, fully self-contained, no chart library), placed under the gauge card on all three pages. Display-only, no DMZPi compute (same contract as the HTML tables and Leaflet maps). See ARCHITECTURE §5.4.
Version 2026.6.24.7 — June 24, 2026
The Scorecard now flags what needs attention — and reports its own drift weekly
- The Scorecard page now opens with a "Needs attention" box that calls out, in plain terms, where the predictors are drifting — e.g. "the rise-likelihood engine over-warns on Boxley / Mulberry / Richland," "the heaviest-rain band is less reliable than the band below it," "two crest predictors are off-calibration." The page tells you what to look at instead of making you hunt for it.
- A weekly summary now goes out automatically (behind the scenes, to the operator) so the system surfaces its own drift without anyone opening the page — closing the loop on self-checking without manual review.
Not user-facing, recorded for completeness: score_all.py now computes a flags array (min-n-guarded: empirical over-warn ≥70% no-rise at n≥20, band inversion above_p75 vs. p50_to_p75, physics within-±20% <50% at n≥15, Ponca override-vs-raw flood-Brier gap, recession never-reached ≥60% once graded) into scorecard.json; /scorecard renders the "Needs attention" box from it. New prediction_eval/scorecard_digest.py (weekly cron Mon 07:30 Central) reads the scorecard, formats a per-family accuracy snapshot + the flags, and sends a Signal DM via the existing signal_config.yaml (same signal-cli plumbing as scp_alert / data_age_alert). This is Phase 3 of the prediction-logging initiative — the self-checking / feedback half. The harness-consolidation refactor was deliberately deferred (a risky change to working cron code with no user benefit). See ARCHITECTURE §4.13 + §16-14 + §7.2.
Version 2026.6.24.6 — June 24, 2026
Scorecard now also tracks the downstream-propagation forecast (recording started)
- The Scorecard page has a new "Downstream Propagation" section. When Ponca rises, the system predicts whether — and how big — a bump reaches Pruitt and then St. Joe / Grinder Ferry, and how many hours after Ponca peaks. Those predictions are now recorded and will be graded: did a noticeable bump actually come, was it the right size, and did it arrive in the predicted window?
- Nothing to show yet — like the Buffalo rise engine, this only logs during an actual Ponca rise, and a downstream crest can take most of a day to play out, so the first graded results appear after the next event. With this, every live forecast the system makes is now on the self-grading loop.
- Experimental, like the rest of the Scorecard.
Not user-facing, recorded for completeness: ponca_analog.py now folds the per-reach propagation block (lag window, crest band, bump/no-bump flag, current flow) into each ponca_analog_history.jsonl record — the record step the predictions had been missing. New prediction_eval/propagation_eval.py settles each matured event two-stage: it finds Ponca's actual peak from buffalo_study/data/gauges, then for Pruitt (07055680) and St. Joe (07056000) grades the bump/no-bump call (crest ≥ 1.25× baseline & +50 cfs), the magnitude-band hit, and the timing window relative to Ponca's peak — using the cycle nearest Ponca's peak as the representative prediction. A --selftest (10 checks) validates the logic. score_all.py folds the settle in and adds a propagation block; /scorecard renders it; Coverage flips the propagation forecast to "graded." This completes Phase 2 of the prediction-logging initiative — every live predictor family is now recorded and graded. See ARCHITECTURE §4.13 + §16-14.
Version 2026.6.24.5 — June 24, 2026
The Ponca "AI Analysis" cards now read like a person — and the numbers make sense
- Rewrote both Ponca AI cards (the rainfall outlook and the downstream propagation card on the Buffalo page) to read in plain language for a casual paddler — and, more importantly, fixed the numbers.
- No more peaks below the current level. The rainfall card had been quoting a "typical peak" from past storms even when the river was already past it (e.g. "peak ~364 cfs" while sitting at 415). It now floors the peak by what the river has actually done — so it says things like "it's near the top for this storm, ~431, and shouldn't climb much more."
- Propagation numbers fixed. The downstream card was predicting crests below where Pruitt and St. Joe already sat (e.g. "St. Joe will crest at 948–1,638" while it was already at 1,820). It now models the added bump the Ponca rise puts on top of each downstream gauge's current flow — and when that bump is small (a light rain), it plainly says "no noticeable change downstream" instead of quoting a fake crest window.
- Plainer, less robotic. Out: "no deterministic watershed rainfall alerts or upstream triggers firing." In: a short, plain read of whether the creek's coming up, how high, and when. The safety behavior is unchanged — when heavy rain hits the feeder creeks or the upstream river floods, the card still leads with that and leans into the bigger outcome.
Not user-facing, recorded for completeness: in buffalo_dashboard/ponca_analog.py, both qwen system prompts were slimmed and rewritten for a casual-paddler audience (no jargon, fact-fed, model reasons rather than recites) with one hard rule — never state a peak/crest at or below the current flow. build_propagation() now models est_crest = reach_current + (Ponca rise above baseline) × amplification, floored at the reach's current value (was Ponca_flow × amp absolute, which fell below a downstream gauge's own flow whenever Ponca was small relative to that reach's drainage), plus a significant / added_bump_cfs gate so small pulses read "minor bump, no noticeable change." A qualitative 6-hour trend word (holding steady / creeping up / rising steadily / rising fast / easing down / dropping fast) keeps the model from overstating a slow creep. The deterministic override floors (upstream Boxley wave, heavy-rain, watershed-feeder alerts) are unchanged — only their narration. See ARCHITECTURE §4.6.
Version 2026.6.24.4 — June 24, 2026
Scorecard now tracks the Buffalo rise engine (recording started)
- The Scorecard page has a new "Buffalo Rise Engine" section. Behind the Buffalo dashboard, the system makes a per-gauge "a rise is coming" nowcast (slight / moderate / large, with a timing window) from local rain and upstream propagation. Until now those predictions were computed, shown indirectly, and then thrown away every 15 minutes — never checked. They're now recorded and will be graded on whether each gauge actually rose, and whether it rose within the predicted window.
- Nothing to show yet — the rise engine only fires during rain events, and it's dry right now, so the section reads "recording started, no events captured yet." The first results appear after the next storm. (This was the largest prediction surface that had been completely untracked.)
- Experimental, like the rest of the Scorecard.
Not user-facing, recorded for completeness: new prediction_eval/buffalo_predictions_archive.py (modeled on recession_archive.py) — --record on a 15-min cron (:09,:24,:39,:54, debounced) logs each active predictions[gauge].combined_category from buffalo_output.json (with timing window + current value) to buffalo_ledger/<date>.jsonl; --settle grades vs. the gauge's actual discharge rise over [generated_at, timing_high + 18 h] (rose if peak ≥ 1.25× start AND ≥ +30 cfs → records rise magnitude, hours-to-peak, timing-in-window; else no_rise / censored); --score aggregates. A --selftest (14 synthetic checks) validates the logic since production is dry. score_all.py folds the settle in and adds a buffalo_rise block; /scorecard renders it; Coverage splits Buffalo into "rise predictions: graded" and "flood_risk + propagation_alerts: not yet logged." Magnitude is captured per category (categories derive from rainfall, not gauge rise) so the rainfall→rise mapping calibrates over time. ARCHITECTURE §4.13 + §16-14 + §7.1.
Version 2026.6.24.3 — June 24, 2026
Scorecard now grades the Ponca "AI Rainfall Event Analysis"
- The Scorecard page now scores the Ponca AI Rainfall Event Analysis (the orange card on the Buffalo page). Every call it makes during a rain event is now recorded and later graded against what the Ponca gauge actually did — so you can see how often it gets the size of an event right. Until now it was logged but never scored.
- What it shows: how often the predicted class (Fizzle / Moderate / High / Flood) matched the actual crest (exactly, and within one level), how close the "typical peak" estimate landed, and how well-calibrated the flood-risk % has been. On the ~4 weeks logged so far it gets the class within one level 95% of the time, and its predicted peak range has captured the actual crest about half the time — though it tends to over-call Flood when the river actually tops out at High.
- An honest self-check it surfaced: during the long recession after a flood, the card's deterministic "flood floor" stays elevated (e.g. 85%) while the river is already falling — so on the logged sample the raw analog has been a bit better-calibrated for flood risk than the floored version. Catching things like that is the whole point of this page; it points at a future tuning. (Small sample — directional only.)
- Experimental, like the rest of the Scorecard; the numbers will firm up as more events are logged.
Not user-facing, recorded for completeness: new prediction_eval/ponca_analog_eval.py reads the producer's append-only ponca_analog_history.jsonl (read-only) and grades each armed call against Ponca 07055660's max discharge over a forward 36 h window (from buffalo_study/data/gauges), writing ponca_analog_settled.jsonl (idempotent, keyed by generated_at). It grades the k-NN class/peak (modal vs. actual class, median_peak_cfs MAE, p25–p75 band hit) and the flood Brier for flood_risk_pct (override-floored) vs. raw_flood_risk_pct (raw k-NN, on the common sample). score_all.py calls settle() inline (no extra cron) and adds a ponca_analog block to scorecard.json; the /scorecard route renders it; the Coverage table flips Ponca from "logged, not graded" → "graded." See ARCHITECTURE §4.13 + §16-14.
Version 2026.6.24.2 — June 24, 2026
Retired the experimental neural-net (LSTM) predictor
- The old LSTM forecast is fully retired. It was an experimental neural-net gauge predictor for Richland and Cossatot; its on-page cards were pulled back in April (too many false alarms), and it has now been fully decommissioned behind the scenes. Nothing paddler-facing changes — the physics and empirical forecasts you actually see are unaffected.
- On the new Scorecard page, the LSTM no longer appears in the "Coverage" list. It briefly showed there as "not yet graded" right after the page launched; since it is retired, it has been removed.
Not user-facing, recorded for completeness: the :14 nn_predict.py inference cron was commented out, the dead nn_prediction read/embed was removed from cossatot_assemble.py + richland_assemble.py (the key no longer appears in their output JSON), the stale "LSTM forecast" wording was dropped from the Richland page's social/meta description, and all LSTM-only artifacts (nn_predict.py, nn_predict_debug.py, nn_alert.py, nn_alert_state.json, nn_output.json, both model_epoch100.pt weight files) were moved to /home/dave/creeks/retired_lstm/ (reversible — a README there documents how to resurrect). The HUC12 masks under /home/dave/models/ were kept — they are read by the live Richland physics QPE reader and the map-polygon builder, not just the LSTM. Full record in ARCHITECTURE.md §4.10 + §14 Gotcha #10. Side benefit: one less hourly job on the 2 GB ScriptPi.
Version 2026.6.24.1 — June 24, 2026
New: a Prediction Scorecard page — see how accurate the site's forecasts have actually been
- There's a new "Scorecard" page (linked from the home page and the footer of every page) that grades the site's own forecasts against what the rivers actually did. Every prediction the system makes is now recorded and checked later — so you can see how much to trust it, instead of just taking its word.
- It covers three kinds of forecast: the crest predictors (Cossatot, Richland, Hailstone — how close the predicted peak was to the real one), the "likelihood of a rise" headlines (how often a forecast rise actually showed up vs. how often the rain fizzled), and the recession countdowns (how close the "time to drop to X" estimates land — these are brand-new, so that section is still filling in over the coming weeks).
- It's honest about its own blind spots. Right now the scorecard openly shows that the "likelihood of a rise" engine over-warns — on several rivers a forecast rise doesn't actually materialize most of the time. Showing that plainly is the point; it's the first step toward fixing it. A "Coverage" section at the bottom lists which forecasts are graded and which aren't graded yet.
- Experimental. This is a behind-the-scenes accountability tool we're now exposing publicly. The numbers will shift as more predictions settle, and some forecast types aren't graded yet.
Not user-facing, recorded for completeness: a new ScriptPi subsystem /home/dave/prediction_eval/ (score_all.py, cron 01:30 daily) reads the settled prediction archives for three already-self-recording families — physics (<basin>/predictions/), empirical (<gauge>_empirical_predictions/), and recession (recession_eval/ledger/) — and writes one display-ready scorecard.json, SCP'd to DMZPi. Physics is scored on peak MAE / bias / within-±20%; empirical on hit-rate (rose to ≥ called tier = verified + missed_higher) vs. no-rise rate (no_change), broken out by basin, confidence, and rainfall percentile band (which surfaces the known selection bias — the above_p75 band currently shows a higher no-rise rate than p50_to_p75); recession reuses recession_archive.score(). The DMZPi /scorecard route renders the JSON read-only (no compute on DMZPi; validated via the venv test_client before the gunicorn restart). This is Phase 1 of a system-wide "log every prediction, grade it later" initiative — audit + plan in creekintelligence/research/prediction_audit/. The still-ungraded predictors (Ponca analog, downstream propagation, the Buffalo per-gauge rise engine, the retired LSTM) are listed as not-yet-graded in the page's Coverage table and are Phase 2.
Version 2026.6.23.1 — June 23, 2026
Recession countdowns are now realistic — and honest about how sure we are
- The "Time to …" countdowns now reflect how rivers actually recede. They used to take the current (fast) drop and extrapolate it in a straight line, which badly over-shot — on the flashier gauges it could say a creek would hit "Too Low" in 2 days when history says it's more like a week-plus. Every gauge now uses a per-creek recession curve built from years of USGS history: the drop is fast up high and slows way down near baseflow, just like the real river, and the estimate is anchored to how fast the current recession is actually falling. For example, Pruitt's "Time to Too Low" went from ~2 days to ~7 days — much closer to reality. This is on every recession card now (Cossatot, Richland, Hailstone, the Buffalo mainstem gauges, and Mulberry / Big Piney's float sections). Still an estimate — it assumes no new rain.
- St. Joe and Harriet no longer show a "Time to Too Low." Those two lower Buffalo gauges almost never actually drop to the Too-Low mark — they recede into the low hundreds of cfs and just sit there (historically they reach Too Low only ~2% of the time), so that countdown was simply wrong. It's now hidden for them; they still show "Time to Low but Floatable." The upper gauges, which genuinely do bleed all the way down, are unchanged.
- The "Confidence" label now means what you'd expect. It used to reflect how much recent data we had — so it could say "high" on a fuzzy, days-out guess. Now it reflects the actual uncertainty of the number: a tight, near-term call reads high; a wide, multi-day one reads low. (A 7-day recession forecast is a coin-flip on whether it even stays dry, so it'll honestly say low.)
- The countdowns read consistently everywhere. The Buffalo mainstem gauge cards and the Mulberry / Big Piney float-section cards now use the same "Time to Optimal → Time to Low but Floatable → Time to Too Low" wording and order as the standalone creek pages.
Not user-facing, recorded for completeness: the timing model is a per-gauge master recession curve — a flow-dependent decay rate k(Q) learned from USGS history, integrated to a transit time and event-anchored to the current observed rate (clamped 0.5–2×) — in /home/dave/recession_eval/recession_curve.py + recession_curves.json (9 gauge curves), imported by every *_assemble.py compute_recession() with the old single-exponential kept as a fallback. The St. Joe/Harriet suppression uses a config recession_baseline (empirical floor, ~p10) as the decay asymptote so any threshold below it returns no countdown. Confidence is now derived from each prediction's relative spread + horizon (recession_curve.confidence_level). A prediction-evaluation framework (recession_archive.py, on cron) now records every recession countdown to a ledger and settles it against actuals to score accuracy over time. Threshold keys were standardized to too_low/low_floatable/optimal across all configs/assemblers. Full design, history pulls, and analysis live in creekintelligence/research/recession_eval/.
Version 2026.6.22.2 — June 22, 2026
Clearer recession countdowns + gauges stop briefly greying out
- The "Recession Countdown" cards now read in plain falling order — Time to Optimal → Time to Low but Floatable → Time to Too Low. On the Cossatot, Richland, and Hailstone (Upper Buffalo) pages, each countdown is labeled "Time to …" and laid out left-to-right in the order the creek actually drops through the levels, color-coded to match the level legend (green Optimal, yellow Low but Floatable, red Too Low). When a creek is running above the recommended range and falling, the card now leads with Time to Optimal — when the high water is expected to settle back into the good range — then the lower levels after. (Previously the above-recommended case showed only the two lower levels, and on the Hailstone card the order and colors were off.)
- Hailstone's recession card sizing is fixed — the countdown numbers had been rendering in an odd, unstyled font; they now match the big, readable style the other creeks use.
- The "Confidence" line under each countdown is clearer — centered and bold, and it now reads "Confidence in countdown timing" so it's obvious the High/Medium/Low refers to how trustworthy the time estimates are (how cleanly the creek is falling), not the level itself.
- Gauges no longer briefly turn grey when a single USGS reading drops out. Every so often the USGS feed returns nothing for one gauge for a cycle, which used to blank that gauge (grey, "Unknown") for ~15 minutes until the next update — and it rotated across gauges (Boxley, Ponca, Pruitt…). The system now retries, and if a reading is still missing it holds the last good value (still timestamped, so you can see its age) rather than going blank — unless the gauge has truly been silent for over 90 minutes, in which case it still shows as stale.
Not user-facing, recorded for completeness: the three height/CFS recession cards were consolidated into one shared render_recession_card() helper in dashboard.py (they had drifted into near-duplicate blocks edited in parallel). Hailstone's recession model now also emits hours_to_high (time to fall to the 2000-cfs Above-Recommended boundary) in hailstone_output.json. The gauge-fetch resilience lives in creeks/fetch_gauges.py: fetch_stream_readings() retries transient empty USGS responses, and main() carries forward the previous good reading (new carried_forward flag, 90-minute cap) so one failed pull no longer greys a gauge.
Version 2026.6.22.1 — June 22, 2026
Ponca rainfall card now leads with the trusted signals + new downstream propagation card
- The "Ponca Gauge — AI Rainfall Event Analysis" card now leads with the deterministic signals, not the historical analog. During a developing event it reads, in order of reliability: the watershed rainfall alerts (the hand-calibrated tripwires on the specific drainages above Ponca — Upper Buffalo, Beech Creek, Adkins, Boen Gulf), the upstream Boxley gauge, and the observed rainfall + antecedent wetness. The historical-analog comparison is now a clearly-labeled secondary note — it leads only on ordinary, low-level rain days (its accurate range) and can no longer talk the card down to "won't develop / Fizzle" while those upstream signals are firing. The card also now says the river is in flood when it's already there (instead of "headed to flood"), and pivots to the live concern — the continuing climb and downstream propagation. It refreshes every 15 minutes (was hourly). Prompted by the June 22 event, where the old analog-led card read "won't develop into a meaningful rise," then "could go either way," while the river was on its way to a major flood.
- New "Ponca Gauge — AI River Rise & Propagation Analysis" card (
/buffalo/) — appears above the mainstem gauges only while the river is rising. It narrates how a rise at Ponca rolls downstream: roughly when the surge will crest at Pruitt (~5 h behind Ponca, about Ponca's level) and at St. Joe / Grinder Ferry (~14 h behind, typically several times higher), and how high each is expected to get — as a range, compared to that spot's own flood stage. Travel time shifts with how wet the ground is (dry ground = slower). Built for NPS rangers and campers weighing the gravel bars downstream — it answers "how high will Grinders get, and how long before it spikes." Experimental — timing is approximate and magnitude is a range; verify against the gauges. Runs on the same local AI model (no external calls, no cost).
Not user-facing, recorded for completeness: the rainfall card now reads the live creek-alert state (read-only) and the Buffalo physics propagation/flood signals already in buffalo_output.json; the propagation card's lag/amplification constants come from the 12-year USGS archive cross-checked against the Buffalo Study's calibrated 2026 event log, and are antecedent-conditional. Both narratives are produced by the local qwen3.6:27b model — the propagation one is a separate focused prompt embedded in ponca_outlook.json.
Version 2026.5.24.1 — May 24, 2026
Ponca Gauge historical event reporting + experimental AI rainfall event analysis
- New Ponca Gauge Historical Event Reporting page (
/ponca/historical/) — a deep history of how the Buffalo at Ponca has behaved, using the National Park Service flow buckets for the Ponca→Pruitt commercial-float section (Very Low <100, Low 100–200, Moderate 200–900, High 900–1600, Flood ≥1600 cfs; outfitters may launch 100–1600). It shows days per year in each stage and a storm-by-storm catalog back through the radar-rainfall record (Feb 2015→present, with earlier flow-only events on an extended page). Each storm lists the rainfall that drove it (basin-average over the four HUC12s above Ponca, plus a per-HUC breakdown and the wettest single sub-watershed), the starting flow, and every ≥4-hour stage the river held on the way up and down. Linked from the Buffalo page below the 3-day forecast. - New "Ponca Gauge — AI Rainfall Event Analysis" card on the Buffalo page (
/buffalo/) — appears above the mainstem gauges only when rain is actively falling over the Ponca headwaters (≥0.25″ accumulated). It compares the unfolding storm to ~166 similar past storms and writes a short, plain-English outlook — the most likely peak stage, and whether there's meaningful risk of blowing past the 1,600 cfs launch ceiling — in qualitative terms ("watching… / likely Moderate / high confidence of Flood"). It updates each hour as the storm builds, switches to an "already crested, now receding" read once past the peak, and disappears after about a day of dry weather. Runs on a local AI model (no external API calls, no cost). Experimental — it's a directional read of upstream rainfall vs. history, not a forecast; always verify against the gauge. - Navigation buttons added to all historical report pages — the Cossatot, Richland, Hailstone, and Ponca historical pages now carry the standard navigation footer (previously they had no way back to the rest of the site).
- Fixed the American Whitewater link on the historical pages (the Ponca-section link had pointed to the wrong run).
Not user-facing, recorded for completeness: built a local archive of MRMS radar rainfall for all 37 Buffalo HUC12 sub-watersheds (2014→present, two source archives) plus full USGS history for all 7 Buffalo gauges, which back the historical report and the analog evaluator. The evaluator (buffalo_dashboard/ponca_analog.py, hourly cron :20, flock) runs a numpy k-NN match against a shipped analog library and calls the local model only when its call changes (~10 inferences per event), writing ponca_outlook.json for the dashboard to render.
Version 2026.5.21.1 — May 21, 2026
PayPal-based donation support
- New
/support/page — explains what donations fund and embeds a PayPal donate button (merchantKZM3SRM3W34US). Dark-themed to match the rest of the site. Includes a fallback text link for cases where the PayPal button image fails to load, and a required disclosure that donations are personal gifts (not tax-deductible — Arkansas Creek Intelligence by Druidnetworks is not a 501(c)(3)). - New
/support/thanks/page — optional return destination after a completed donation. Short thank-you, link back to the gauges. - Unobtrusive "♥ Support this project" footer link added to
/,/gauges/,/watersheds,/cossatot/,/richland/,/hailstone/,/mulberry/, and/buffalo/. Deliberately styled in muted gray near the existing disclaimer — available without nagging. Not added to/admin/,/suggest,/study/*,/changelog, or/guide/. - No new dependencies, no environment variables, no database changes — the donate form posts directly to
paypal.com; PayPal handles payment, receipt email, and merchant deposit. Removing the routes removes the donation surface entirely.
Version 2026.5.20.1 — May 20, 2026
Hailstone reaches feature parity + nightly AI analysis moves to local inference
- Hailstone Intelligence is now a full peer of Cossatot and Richland — the Upper Buffalo run page gained a physics predictor, recession countdown, nightly AI analysis, and per-prediction + per-event archives. Previously the page was composer-only (gauge state + empirical forecast from the buffalo dashboard); it now models rainfall → CFS response for the Boxley drainage (156 cells, ~156 km²) on its own hourly cycle. The same gauge (USGS 07055646) drives both the Boxley card on the main /gauges/ table and the Hailstone-specific tier mapping (500/700/2000 CFS).
- Hailstone gauge tile now shows feet below CFS — the creek system now fetches both flow and gauge height for 07055646 (previously CFS-only). The Hailstone card mirrors Cossatot/Richland's primary-value/secondary-value layout: CFS as the headline value, current stage in feet on a small subdued line below the tier label.
- Nightly AI Analysis Archives moved to local inference — Cossatot's and Richland's nightly calibration analyzers used to call Claude Sonnet via the public API. Both now run against a locally-hosted qwen3.6:27b model on the inference host, using server-default parameters. Hailstone's new analyzer uses the same local model. No external API calls are required for any of the three nightly reviews.
- Nightly analyzer scope expanded to include the empirical forecast — all three nightly reviews now grade two distinct models per day: the physics predictor (which they may also adjust calibration on) and the empirical forecast headline (which they comment on but don't tune — the empirical engine's percentile tables are regenerated separately). Each daily markdown now has an "Empirical Forecast" section showing the headline that was issued, the settled outcome, and the AI's assessment of whether the headline panned out.
- Physics predictor baseline fix — the RISING branch in both
cossatot_predict.pyandrichland_predict.pywas double-counting in-transit water during active rainfall, producing fake peaks of up to +2.0 ft on Cossatot dawn predictions and a similar pattern on Richland. The baseline now holds at the current gauge value until band contributions finish arriving, then transitions to the recession decay. Validation on the worst archived errors: Cossatot 2026-05-20 06:09 prediction went from 5.28 ft → 3.33 ft against an actual peak of 3.29 ft. A retrospective supplement at/cossatot/analysis/2026-05-20-Opus-Supplementdocuments the diagnosis and the per-prediction replay improvements. - Recession countdown now suppresses during active rainfall — when measurable rain is falling near the gauge (>0.05"/hr), the recession card displays "Suppressed — active rainfall in the basin invalidates decay extrapolation" instead of the countdown values. The underlying
recession_k/recession_h_baseparameters are still computed in case the physics predictor needs them, but the dashboard hides time-to-tier estimates that the exponential-decay assumption can't honor mid-event. - Standardized card layout across the three intelligence pages — Cossatot, Richland, and Hailstone now follow the same eight-card structure: Gauge → Recession (conditional) → Rainfall → Map → Physics Predictor → Physics Predictor Archives → Empirical Forecast → Empirical Forecast Archives → Nightly AI Analysis Archive. All archive page titles match their card-link names exactly.
- Color-coded tier breakpoints on the gauge card — the right side of each gauge card now lists all four tiers in their semantic colors (Too Low red, Low but Floatable yellow, Optimal green, Above Recommended blue) with the exact thresholds for each. Replaces the old "Tier breakpoints: <3.0 ft Too Low · 3.0–3.4 …" inline strip that ran together at the bottom of the card.
- "Too Low" gauge tile flipped from gray to red — the colored tile inside the gauge card now uses the same red as the recession card and the tier list when a creek is below its low threshold, matching the Buffalo dashboard's existing scheme. The gray was a holdover from earlier when "Too Low" was treated as a passive state.
- Predictor status text standardized on rainfall language — both non-active states use the same wording on all three pages: "No upstream rainfall to drive a prediction" when QPE is quiet across the watershed, "Upstream rainfall too light to drive a rise" when bands have rainfall but the contributions sum below the rise threshold.
- Subtitle text format unified — all three intelligence pages now use
USGS {gauge id} · {river} near {town}, AR, matching the USGS station's official name. Previously Richland listed zones in the subtitle and Hailstone listed the run name. - Hailstone gauge precip line added — the per-page Gauge precip total (sourced from the USGS 00045 collocated rain gauge on 07055646) now appears in the Hailstone gauge card next to the trend/time lines, matching Cossatot and Richland.
- "Phase 2" header label removed from Cossatot — the Cossatot meta line used to read "Data age: N min · Phase 2"; now reads just "Data age: N min" like the others. The Phase 2 work shipped weeks ago.
Underlying schema, infrastructure, and unit-bug cleanups (not user-facing but recorded for completeness): new hailstone_predict.py + hailstone_calibration.json + hailstone_predictions_archive.py, three new cron entries (:17 Hailstone QPE consumer, :21 Hailstone physics predictor, 23:55 Hailstone nightly analyzer), fixed a 25.4× unit error in the new Hailstone QPE consumer (had been treating already-in-inches shared QPE values as mm and dividing again — antecedent moisture was reading DRY when the basin was actually NORMAL/WET), exposed recession_k/recession_h_base on Richland's gauge output (latent gap that left the physics predictor falling back to a flat baseline instead of an exponential decay), and added a per-supplement file-naming convention (YYYY-MM-DD-suffix.md) for retrospective analyses written outside the nightly cadence.
Version 2026.5.15.1 — May 15, 2026
Stale-Data Warning Banners Across All Mobile Dashboards
- Home page (
/) freshness pill — new always-on indicator at the top of the page with three states: green "Live — updated N min ago" when data is fresh, yellow "Data may be stale — last update was N minutes ago" when past the 30-min threshold, and red "Data feed unavailable — ScriptPi push may be down" whenpredictor_output.jsoncan't be loaded at all (previously the page silently rendered as "All Quiet" during push failures, hiding the outage) - New stale banners on five sub-dashboards —
/cossatot/,/richland/,/hailstone/,/mulberry/, and/buffalo/now render the same yellow top-of-page warning banner that/gauges/and/watershedshave had. Fires only when each page's underlying JSON is past its 30-min_stalethreshold, so the banner only appears when something is actually wrong - New shared helpers —
render_stale_banner(data, expected_interval_min=15)andrender_freshness_pill(data, expected_interval_min=15)live alongside the other freshness utilities (_format_age,_age_color). The banner markup was previously duplicated inline on/gauges/and/watersheds; those two pages now call the helper (no visual change) - Motivation — a recent ScriptPi push failure went unnoticed because the home page and sub-dashboards had no top-of-page indicator that data was stale. Only the two pages that had banners (gauges/watersheds) made the failure visible
Version 2026.4.21.1 — April 21, 2026
Creek Page Title & Buffalo Card Standardization
- White page titles across creek dashboards — Cossatot, Richland, and Buffalo h1s now render in white (
#ffffff) to match the landing page style (previously cyan#4fc3f7) - Cossatot title shortened — "Cossatot River — Watershed Intelligence" → "Cossatot River Intelligence"
- Buffalo title renamed — "Buffalo River Dashboard" → "Buffalo River Intelligence"
- Buffalo gauge cards now color-coded by level — full-card backgrounds match the landing-page scheme: blue (Above Recommended), green (Optimal), yellow (Low but Floatable), red (Too Low), neutral gray (Unknown). Replaces the small inline level badge with a full-width spelled-out level line.
- Sub-section contrast tweak — trend arrow and gauge-sub blocks (Rise Prediction, Recession, Flood Risk) on Buffalo cards now sit on a semi-transparent dark background so their semantic colors remain legible against the colored card.
Version 2026.4.15.1 — April 15, 2026
Buffalo River Dashboard
- New
/buffalo/dashboard — Buffalo River Dashboard page with 5 mainstem gauge cards (Boxley, Ponca, Pruitt, St. Joe, Harriet), 2 tributary signal separator cards (Richland Creek, Bear Creek), interactive Leaflet.js HUC12 rainfall map, zone rainfall table, flood/propagation alert banners, rise prediction and recession countdown sections per gauge - New
buffalo_output.jsondata source — pushed by ScriptPi every 15 min, contains 7 gauge readings, 37 HUC12 QPE values, 8-zone rainfall aggregates, per-gauge rise predictions, recession countdowns, propagation alerts, and flood risk levels - Leaflet.js HUC12 choropleth map — 37 sub-watershed polygons colored by rainfall intensity, 3 toggle modes (QPE 1hr, QPE 24hr, QPF 24hr), 7 gauge circle markers colored by level, CartoDB dark tiles, tooltips with zone name and rainfall values, graceful fallback if GeoJSON not deployed
- GeoJSON static file — simplified
buffalo_huc12_simple.geojson(136KB, 37 features) served from new/static/directory - Contextual recession messages — gauge cards always show recession status: "Already below thresholds" (Too Low), "Rising" (rising trend), "Holding steady" (stable, not receding), "Beyond forecast window" (receding but thresholds far off), or countdown timers with confidence
- buffalo_only gauge filtering — 4 new creeks.yaml entries (Pruitt, St. Joe, Harriet, Bear Creek with
buffalo_only: true) filtered from/gauges/table and landing page cards/counts - Buffalo QPF drainages hidden from
/watersheds/— "Buffalo QPF" family drainages (pruitt_zone, stjoe_zone, bear_creek_zone, harriet_zone) filtered from the watersheds page - QPE/QPF explainer — subtitle below rainfall map: "QPE = Precipitation Estimate (observed) · QPF = Precipitation Forecast"
- Home button in nav footer — gray "Home" button added to the shared
nav_button_footer()bottom row alongside Guide, Changelog, and Suggestions - Buffalo River link — added to landing page tool grid and
nav_button_footer()blue button grid - Centered text across mobile pages — all non-card text (titles, subtitles, data age, section labels, rainfall metadata) centered on Cossatot, Richland, and Buffalo dashboard pages
- Watersheds "Back to Home" repositioned — moved above the page title
- Dashboard grew from ~2,975 to ~3,565 lines
Version 2026.4.7.1 — April 7, 2026
Richland Creek Dashboard & Neural Net Predictors
- New
/richland/dashboard — Richland Creek Watershed Intelligence page (USGS 07055875) with gauge status card, recession countdown, two-zone watershed rainfall table (Upper Richland + Falling Water + Combined), physics predictor card, and LSTM neural net forecast card (8 horizons) - New
/richland/analysis/placeholder routes — "Nightly analysis coming soon" index page; date routes return 404 - New
richland_output.jsondata source — pushed by ScriptPi every 15 min, contains gauge data, two-zone rainfall, physics prediction, and neural net prediction - Neural net predictor card on
/cossatot/— 12-horizon LSTM forecast with peak CFS, forecast timeline table, threshold crossings, and data quality indicators - Shared
render_nn_card()helper — renders identical card layout for both rivers; shows peak forecast, per-hour timeline with peak row highlighted, CFS-to-level threshold crossings, and QPE/ASOS data quality footer; handles null (initializing), error, stale (>90 min), and active states - Physics card renamed on
/cossatot/— "Rise Prediction" / "Prediction" headers changed to "Physics Predictor" with gear emoji across all card states (active, quiet, no data) - Landing page updated — added "Richland Intelligence" to the tool navigation grid; renamed "Cossatot Predictor" to "Cossatot Intelligence"
- Nav footer updated — added Richland Intelligence link to the shared
nav_button_footer()used across all pages; renamed Cossatot link to match - Shared constants refactored —
COSSATOT_LEVEL_COLORSrenamed toLEVEL_COLORS,COSSATOT_TREND_SYMBOLSrenamed toTREND_SYMBOLS(used by both river dashboards) - New constants —
NN_THRESHOLDS(CFS-to-level mappings per basin: Richland 500/1000/1500, Cossatot 150/730/1800),NN_LEVEL_COLORS(gray/green/blue for Too Low/Optimal/High),is_nn_stale()helper - New architecture document —
DMZPI_ARCH_4_7_26.mdsupersedesDMZPI_ARCH_3_11_26.md - Dashboard grew from ~2,460 to ~2,975 lines
Version 2026.3.10.1 — March 10, 2026
Landing Page & Route Restructure
- New landing page at / — mobile-first dark theme with site title, orientation blurb, live status summary, and dynamic creek condition cards
- Creek cards show all Optimal gauges (green) or, if none, all Low but Floatable gauges (yellow); "All Quiet" message when no creeks are runnable
- Status summary line shows gauge and watershed condition counts with color-coded text
- Tool navigation grid — four main buttons (Gauges, Watersheds, Cossatot Predictor, Buffalo Study) plus secondary links (Guide, Changelog, Suggest a Creek)
- Gauge table moved from / to /gauges/ — all table logic unchanged
- Temporary legacy link on landing page points to /gauges/ for returning users
- New /guide/ placeholder page — "Coming Soon" with back link to home
- Back link audit — watersheds, changelog, study, and suggest pages link back to /gauges/; error pages and Cossatot nav link to / (landing)
- Last updated timestamp on landing page converted from UTC to Central time
Version 2026.3.9.1 — March 9, 2026
Four-Color Unification - Unified color language across creek levels, prediction status, and recent rain: Red (nothing) / Yellow (maybe) / Green (go) / Blue (lots) - Prediction status expanded to four tiers: No Alert (red), Watch (yellow), Warning (green), Flood (blue) - Recent Rain column now shows 7-day precipitation total in inches with color-coded background, replacing category labels (MOIST/SEMI-DRY/DROUGHT) - Recent Rain multipliers updated: <0.25" = 1.4x trigger, <0.75" = 1.2x, <1.50" = 1.0x, ≥1.50" = 0.9x - FLOOD status triggers at 200% of effective trigger threshold — indicates exceptional rainfall - Micro-creek lag display: Drainages with 0-1 hour lag now show "NOW" instead of numeric range - Signal alerts updated with lag-aware messaging (micro-creeks show "NOW", mainstem rivers show hours)
Version 2026.3.6.1 — March 6, 2026
Drainage Trigger & Timing Calibration - Adkins: 2.0" / 4hr → 2.5" / 6hr - Boen Gulf: 2.0" / 4hr → 2.5" / 6hr - Upper Buffalo: window 6hr → 12hr, lag 4-6hr → 6-8hr - Beech Creek: 1.5" → 2.0" - Upper Kings: 1.5" → 2.0" - Osage: 1.5" / 4hr → 2.5" / 6hr - Richland Main: window 6hr → 12hr - Falling Water: 1.5" / 6hr → 1.75" / 12hr - Upper Cossatot: window 6hr → 12hr - Upper Big Piney: window 6hr → 24hr, lag 10-12hr → 12-16hr - EFLB: 1.5" → 2.0" - Pine Creek OK: window 6hr → 12hr
Version 2026.3.5.3 — March 5, 2026
Cosmetic Updates - Renamed "DRY" status to "QUIET" on the Watersheds page and in alert bar logic (same red styling, new CSS class .st-quiet). - Renamed "Conditions" column to "Recent Rain" and changed from styled badge spans to full-cell background coloring (matching the Status column style). - Updated status_colors/status_text_colors dicts to use "QUIET" key.
Version 2026.3.5.2 — March 5, 2026
Sticky Status Hold - WATCH and WARNING statuses now hold for the duration of a drainage's lag time plus a 2-hour buffer before clearing, preventing premature status downgrade before water reaches the gauge.
Antecedent Dryness System - New "Conditions" column on Watersheds page showing MOIST, SEMI-DRY, or DROUGHT based on recent rainfall history. - Trigger thresholds automatically increase during dry conditions: +15% for SEMI-DRY, +30% for DROUGHT. - Dryness is computed from rolling 7-day and 30-day precipitation totals per drainage. - Trigger column on Watersheds page now shows the effective (adjusted) trigger value.
Cossatot Drainage Update - Upper Cossatot trigger raised from 1.00" to 1.25" in 6 hours. - Upper Cossatot lag time updated from 3-6 hours to 8-10 hours based on observed March 5 event.
YAML Sync - Creek and drainage definitions now automatically sync from ScriptPi to DMZPi every 15 minutes, ensuring single source of truth.
Changelog - Added this changelog page, accessible from the footer of both dashboard pages.
Version 2026.3.5.1 — March 5, 2026
Baseline version. All prior changes consolidated.
WATCH / WARNING Terminology - Renamed "TRIGGER" status to "WARNING" to align with NWS conventions. - WATCH threshold raised from 50% to 75% of trigger value to reduce false positives.
Color Scheme Standardization - Watersheds page: RED = DRY (no go), YELLOW = WATCH (maybe), GREEN = WARNING (go time). - Main creek page: Watershed radar column and alert bar colors match the same scheme. - Alert bar is now green for WARNING, yellow for WATCH-only.
Drainage Trigger Updates - Bobtail Creek: 1.5" → 2.0" in 6hr - Long Devils Fork: 1.5" / 4hr → 2.5" / 6hr - Big Devils Fork: 1.5" / 4hr → 2.5" / 6hr - West Fork Shop Creek: 2.0" / 4hr → 2.5" / 6hr - Thomas Creek: 2.0" / 4hr → 2.5" / 6hr